 |
| E. O. Wilson (top) Robert H. MacArthur (below) (from bioquest.org) |
The scenario
Imagine a newly formed island completely devoid of life. The island lies off the coast of a mainland, which will be its only source of organisms. The island gains species only through colonization and loses species only through extinction. (Note - evolution is ignored in this model. We'll come back to that in later posts!)
Colonization in the model is defined as the arrival of a new species to the island. Arrivals of individuals whose species is already on the island do not count. Obviously, colonization would increase biodiversity (measured as the number of species) on the island. Extinction is defined as we use it today -- the loss of a species on the island when the last member of that species dies or leaves. This, of course, would decrease biodiversity on the island. Species that go extinct on the island might well colonize it again at a later time.
How would the rates of colonization and extinction change over time?
Recall that our island starts out with no species. At first, nearly every individual that arrives from the mainland (the source of species) is new to the island and therefore "counts" as a colonist. So the colonization rate would start out very high and slow down as the island accumulated species, because over time it becomes less and less likely that a new arrival is a new species to the island.
 |
| Click to enlarge |
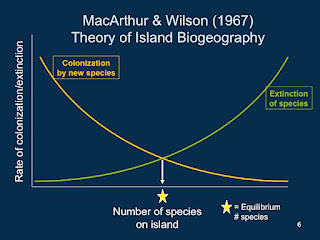
These patterns are easier to interpret with a graph. Colonization rate and extinction rate go on the Y-axis and number of species on the island goes on the X-axis. The two forces (colonization and extinction) are described by two curves swooping in opposite directions.
The curves cross somewhere along their length; this point represents an equilibrium between colonization and extinction. At some number of species there are just enough new colonists to counterbalance the number of extinctions on the island. Biodiversity on the island should hover around this number.
What does this mean?
- The number of species on the island should reach an equilibrium number of species, given enough time.
- The actual species that are on the island will change over time. New colonists will arrive and resident species will go extinct, but the number of species will stay about the same.
How well do real data conform to MacArthur and Wilson's remarkably simple model? To answer that question, we go to a classic test of this model that involves the California Channel Islands.
Island Biogeography on California's Channel Islands
 |
| Jared Diamond (from UCLA Foundation site) |
The number of birds on each of the islands was about the same between the two time periods, usually differing by no more than four species. The one exception was Santa Rosa Island, which had 25 bird species breeding in 1968 and only 14 breeding in 1917. Howell himself considered this survey to be incomplete. So it appeared that the number of species (biodiversity) is relatively constant over time.
 |
| Data from Diamond (1969) Click to enlarge |
But the Channel Islands is an archipelago, a group of islands. How might we expect diversity to vary across the islands of our archipelago?
Stay tuned for more island biogeography fun!
References:
Diamond, J. M. 1969. Avifaunal equilibria and species turnover rates on The Channel Islands of California. The Proceedings of the National Academy of Sciences 64: 57 - 63.
MacArthur R. M. and E. O. Wilson. 1967. The Theory of Island Biogeography. Princeton University Press: Princeton, NJ.
Photo credits:
http://www.bioquest.org/esteem/esteem_details.php?product_id=211
https://www.uclafoundation.org/docs/leadership/speakers.html
No comments:
Post a Comment